Point Source Catalog
Though SOXS creates events from point sources as part of the background, one may want to study the point source properties in detail, and desire finer-grained control over their generation. SOXS provides the make_point_sources_file() function for this purpose, to create a set of photons from point sources using the point-source background model and store them in a SIMPUT catalog.
First, import our modules:
[1]:
import matplotlib

matplotlib.rc("font", size=18)
import soxs
Second, define our parameters:
[2]:
exp_time = (300.0, "ks")  # in seconds
fov = 20.0  # in arcmin
sky_center = [22.0, -27.0]  # in degrees
Now, use make_point_sources_file() to create a SIMPUT catalog made up of photons from point sources. We’ll set a random seed using the prng parameter to make sure we get the same result every time. We will also write the point source properties to an ASCII table for later analysis, using the output_sources parameter:
[3]:
soxs.make_point_sources_file(
    "my_cat.simput",
    "ptsrc",
    exp_time,
    fov,
    sky_center,
    prng=24,
    output_sources="point_source_table.dat",
    overwrite=True,
)
soxs : [INFO ] 2026-04-13 07:42:05,412 Appending source 'ptsrc' to my_cat.simput.
[3]:
<soxs.simput.SimputCatalog at 0x152ac3e00>
In a subsequent invocation of make_point_sources_file(), one could use the ASCII table of sources as an input to generate events from the same sources, using the input_sources keyword argument.
Next, use the instrument_simulator() to simulate the observation. Since we explicitly created a SIMPUT catalog of point sources, we should turn the automatic point-source background in SOXS off by setting ptsrc_bkgnd=False:
[4]:
soxs.instrument_simulator(
    "my_cat.simput",
    "ptsrc_cat_evt.fits",
    exp_time,
    "lynx_hdxi",
    sky_center,
    overwrite=True,
    ptsrc_bkgnd=False,
)
soxs : [INFO     ] 2026-04-13 07:42:05,842 Simulating events from 1 sources using instrument lynx_hdxi for 300 ks.
soxs : [INFO     ] 2026-04-13 07:42:07,893 Scattering energies with RMF xrs_hdxi.rmf.
soxs : [INFO     ] 2026-04-13 07:42:11,824 Detected 5574987 events in total.
soxs : [INFO     ] 2026-04-13 07:42:11,827 Adding background events.
soxs : [INFO     ] 2026-04-13 07:42:11,876 Adding in astrophysical foreground.
soxs : [INFO     ] 2026-04-13 07:42:19,934 Adding in instrumental background.
soxs : [INFO     ] 2026-04-13 07:42:20,928 Making 51232573 events from the galactic foreground.
soxs : [INFO     ] 2026-04-13 07:42:20,929 Making 784421 events from the instrumental background.
soxs : [INFO     ] 2026-04-13 07:42:30,421 Observation complete.
soxs : [INFO     ] 2026-04-13 07:42:30,426 Writing events to file ptsrc_cat_evt.fits.
We can use the write_image() function in SOXS to bin the events into an image and write them to a file, restricting the energies between 0.7 and 2.0 keV:
[5]:
soxs.write_image(
    "ptsrc_cat_evt.fits", "ptsrc_img.fits", emin=0.7, emax=2.0, overwrite=True
)
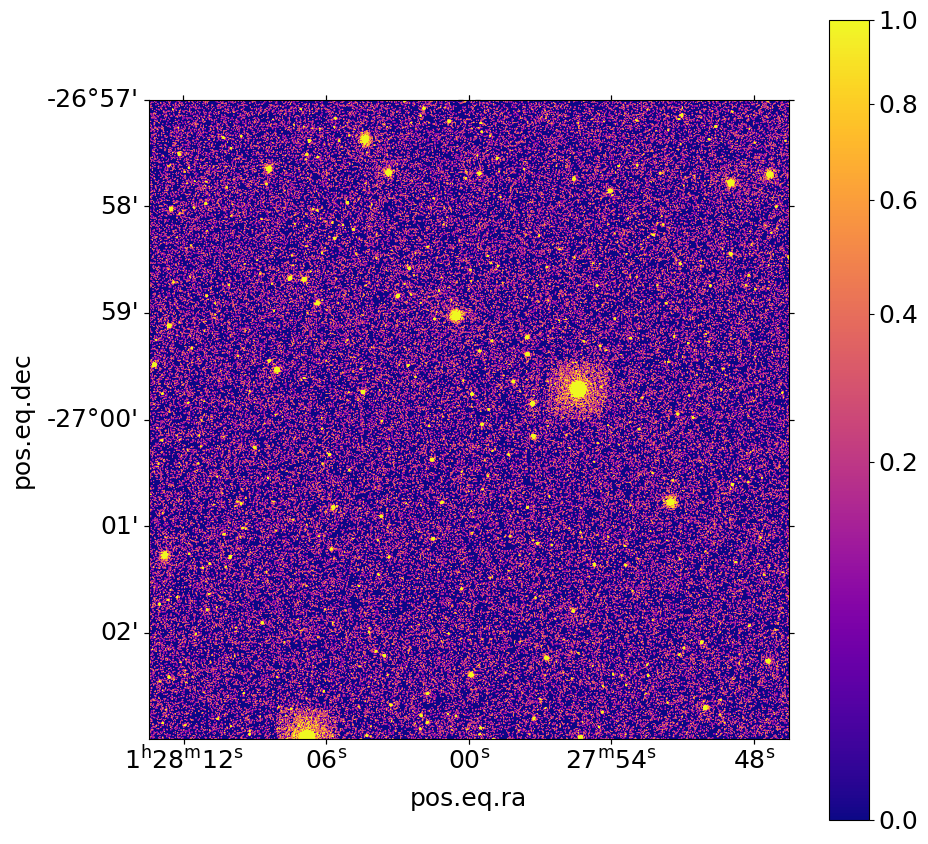
We can now show the resulting image:
[6]:
fig, ax = soxs.plot_image(
    "ptsrc_img.fits",
    stretch="sqrt",
    cmap="plasma",
    width=0.1,
    vmin=0.0,
    vmax=1.0,
    center=[22.0, -27.0],
)