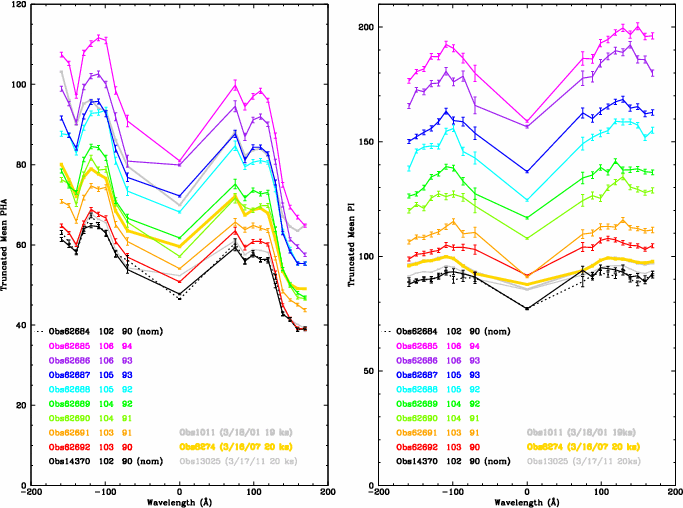
| Obsid | HVbot | HVtop |
| 14370 | 102 | 90 |
| 62692 | 103 | 90 |
| 62691 | 103 | 91 |
| 62690 | 104 | 91 |
| 62689 | 104 | 92 |
| 62688 | 105 | 92 |
| 62687 | 105 | 93 |
| 62686 | 106 | 93 |
| 62685 | 106 | 94 |
| 62684 | 102 | 90 |

|

|

| |||||||||||||||||||||||||||||||||||
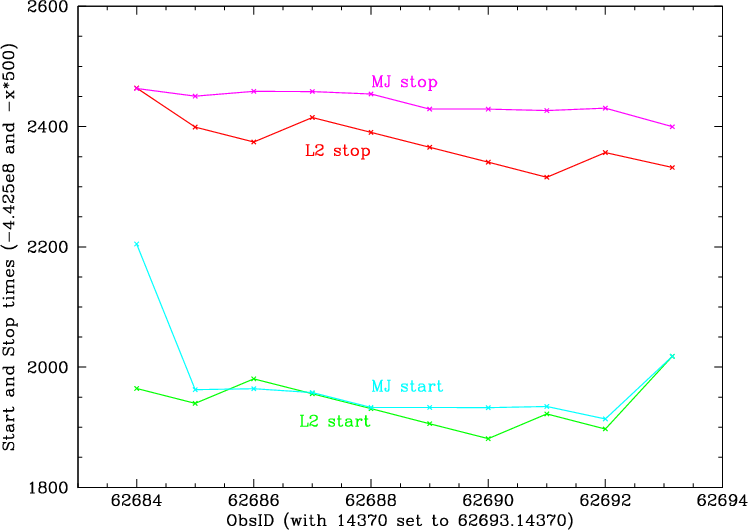
| Table 1. At the meeting, we chose the HV settings used in Obs62687 as the new standard for HRC-S. | Fig. 1 (pdf). Observations start at the bottom of the black trace and then follow in rainbow order (red... green... purple), ending with gray near the center. | Fig. 2 (pdf). Non-intuitive and unimportant--I had extra space to fill--illustration of observation durations, comparing the archive L2 start and stop times with Mike Juda's determination of when the HV was stable. All analyses use data from the intersection of these times. |
| 
| 
| 
|
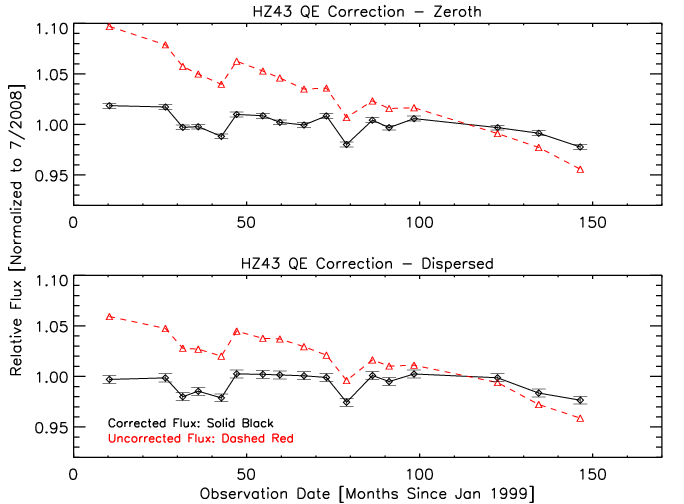
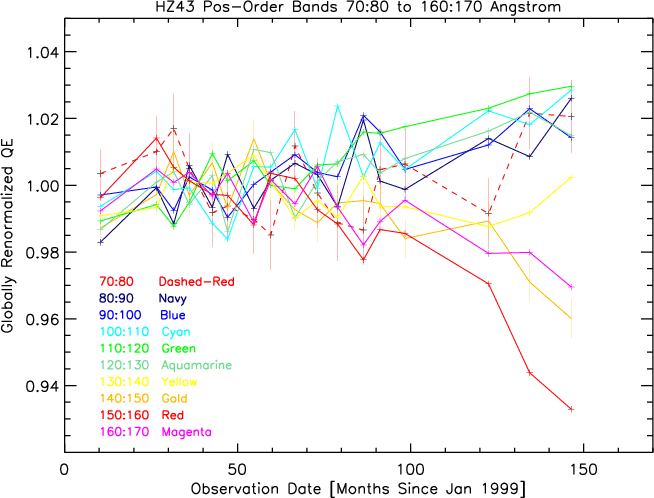
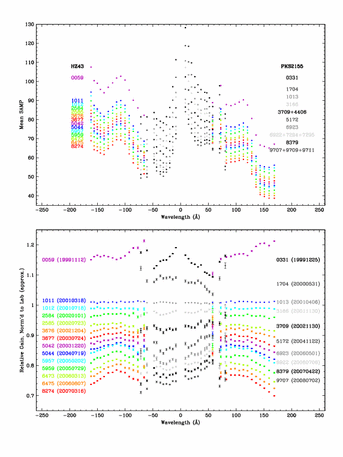
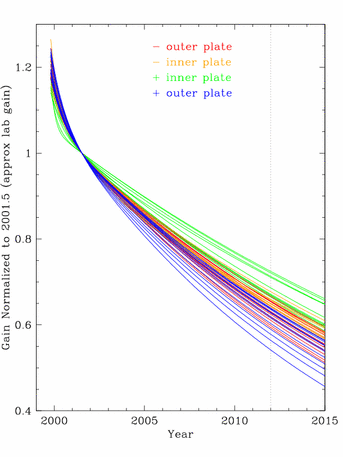
| Fig. 3 (pdf). Relative LETG/HRC-S rates for HZ43, normalized to Jul 2008. Red is for unadjusted rates, black after CALDB adjustments for declining QE. Month 100=obsid8274 of Mar 2007. | Fig. 4 (pdf). CALDB-adjusted QE versus time. There are excess QE losses at the longest + wavelengths, where event amplitudes are smallest. | Fig 5 (pdf). Top: Mean PHA versus wavelength, from HZ43 and PKS 2155 data through 2008. (Means calculated using 5|95% truncation of BG-subtracted data.) Bottom: Mean PHA normalized to values in 2001.5 (approximate preflight lab gain). | Fig. 6 (pdf). Fits to gain trends for the wavelength ranges plotted in Fig. 5. Current gain is typically ~65% of what it was in 2001.5. |
| 
| 
|
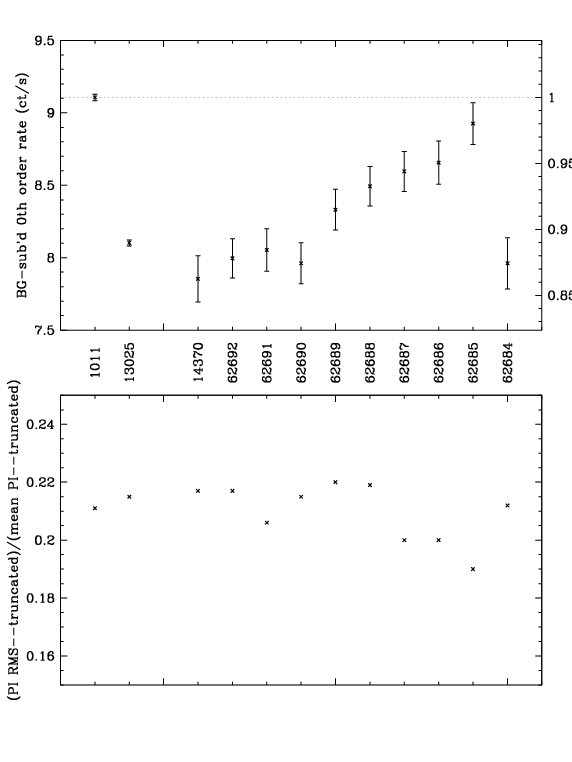
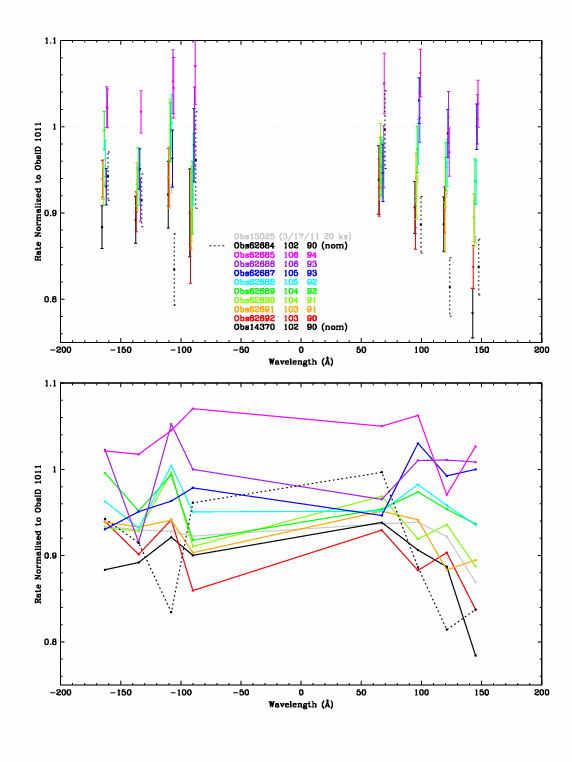
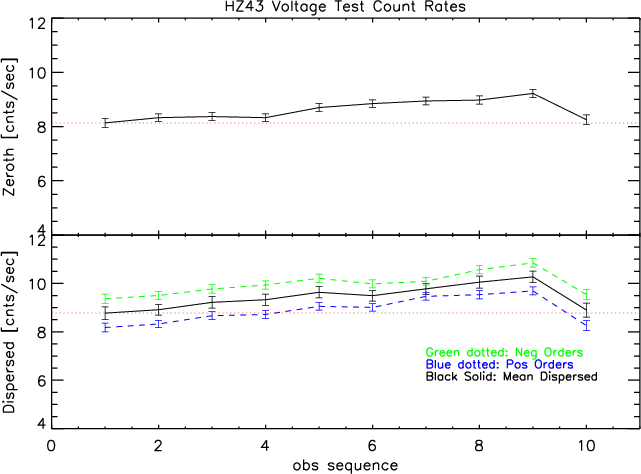
| Fig. 7 (pdf). Rates and PHD widths of HZ43 0th order (30-pixel radius). Obsids 1011 and 13025 are full-length (~20 ks) calibration observations; 1011 (mid-2001) has near-lab gain; 13025 is the most recent (Mar 2011). | Fig. 8 (pdf). Rates of slices of dispersed spectrum, normalized to ObsID 1011. Same data in top and bottom, just different presentation (errorbars or connected). The longest + wavelength slice has experienced the largest QE drop caused by gain loss, but QE appears to be fully restored at higher voltage. | Fig. 9 (pdf). Top: 0th order rate (100-pixel radius). Bottom: Dispersed spectrum rates for + and - orders, 70-155 Å. Rates are background-subtracted. (Scale is wrong for the bottom panel--actually around 21 cts/s.) From Nick Durham. |
| 
| |
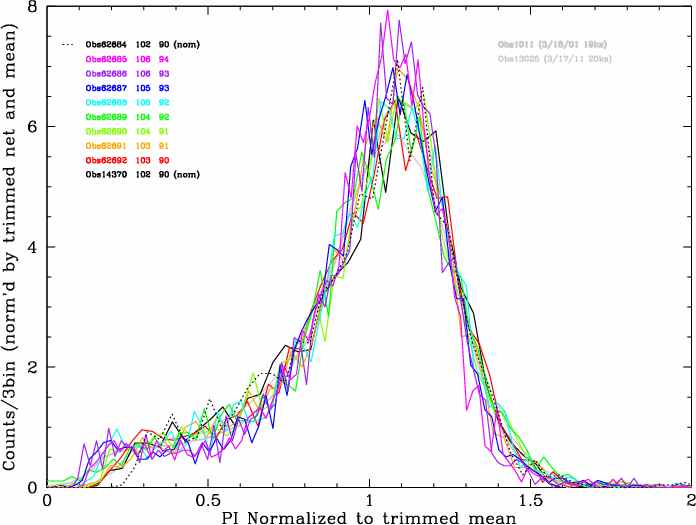
| Fig. 10 (pdf). Truncated (5%,95%) background-subtracted means of 0th order and slices of dispersed spectra, again comparing to previous Cal observations. Obsid 8274 is the last HZ43 observation (Mar 2007) without significant excess QE loss. (A plot of medians is similar but noisier because of integer granularity.) | Fig. 11 (pdf). Normalized PHDs. Generally, obs's with higher gain have less event loss at low PI values. |
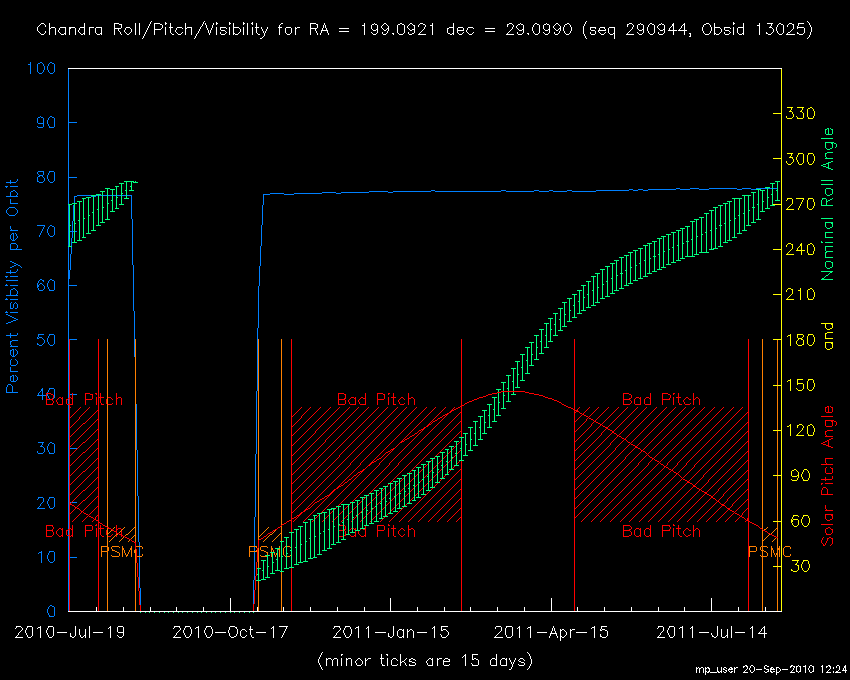
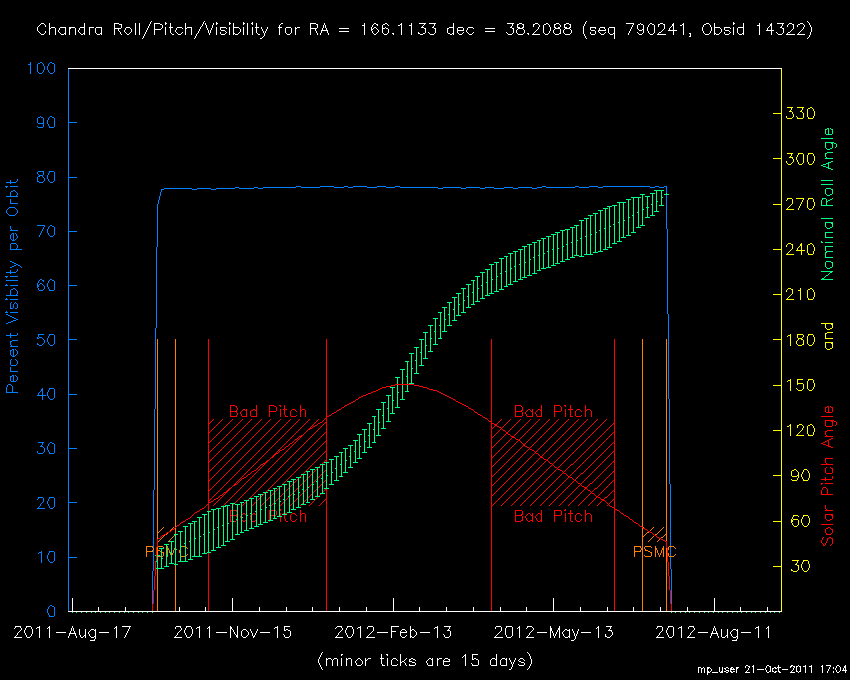
LETG/HRC-S observations of HZ43 and Mkn421 are required for gain and EA/QE calibration, preferably around the same time. The most recent were 3/16/11 (HZ43) and 7/4/11 (Mkn421). Do we need to do before & after measurements or will post-change obs's suffice? Are the Mkn421 obs's coordinated with other missions? Can they be moved earlier? Will HZ43 and Mkn421 suffice for EA/QE calibration or do we need Sirius B, too? What about AR Lac and Capella?
| 
| 
| 
| |||
| HZ43 in LTS 4/11/12 (20ks). | Mkn421 in LTS 7/4/12 (3x10ks). | AR Lac in LTS 9/24/12 (21 points). | Capella just done 12/26/11 (30ks). |
For a more accurate gain calibration I'll need a lot of background data (see Gain Map report fig17) but that will have to be accumulated "naturally" over time. And although it's not really of much practical importance, I'd like to figure out what's going on with the gain around the plate gaps (see fig18: gif, pdf). This could be done using gratingless observations of HZ43 with a couple large Y pointing offsets (around 20') to cover the +side plate gap. TBD (around 3ks?) observations would suffice, but probably can't be justified for just this.