From regular HRC-S/LETG calibration observations of the hot white dwarf HZ 431, it is known that the HRC-S QE has declined steadily at wavelengths longer than 60 Å (200 eV). This drop has been linear since the high tension voltage change in March, 2012, at a yearly loss rate of 2.39 (± 0.04)% (more precisely, the QE decline is modeled as linear versus time with a slope of [1-0.0239] units per annum) in dispersed orders (Fig. 1). While in the past decade there have been increasingly large additional position-dependent corrections necessary for the outer plates, broadly speaking the linear QE decline can be characterized as "grey," i.e., independent of wavelength.
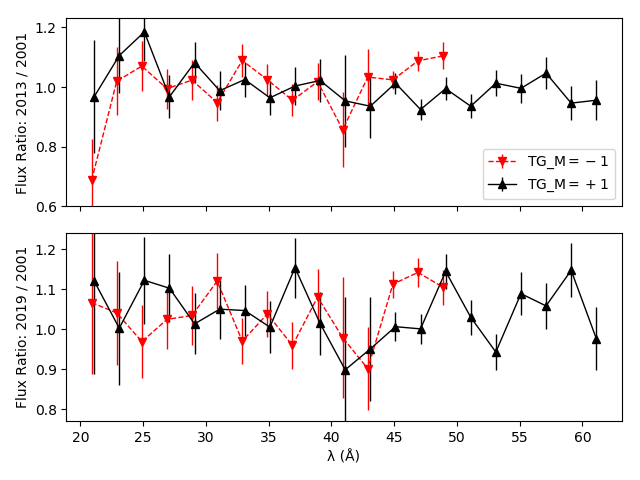
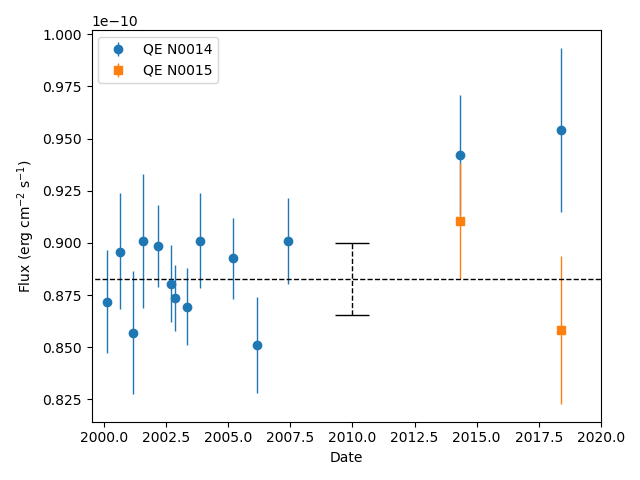
Despite the lack of a standard candle that illuminates the entire detector, there is still one useful source available for relative calibration of the central plate: the isolated neutron star RX J1856.5-3754. This source, although somewhat faint (∼0.11 counts s-1 for positive first order in the 20-60 Å band), yields measurable flux for wavelengths longer than 20 Å on S2, and has been observed with the HRC-S/LETG configuration in 2001, 2013 and 2019. Comparison of fluxes from those epochs, derived with the current CalDB, which extends the 2.39% QE loss per year to all dispersed wavelengths, is consistent with the assumption of grey decline (Fig. 2). The calculated fluxes in both 2013 and 2019 are in agreement to the approximately 10% level with those from 2001.
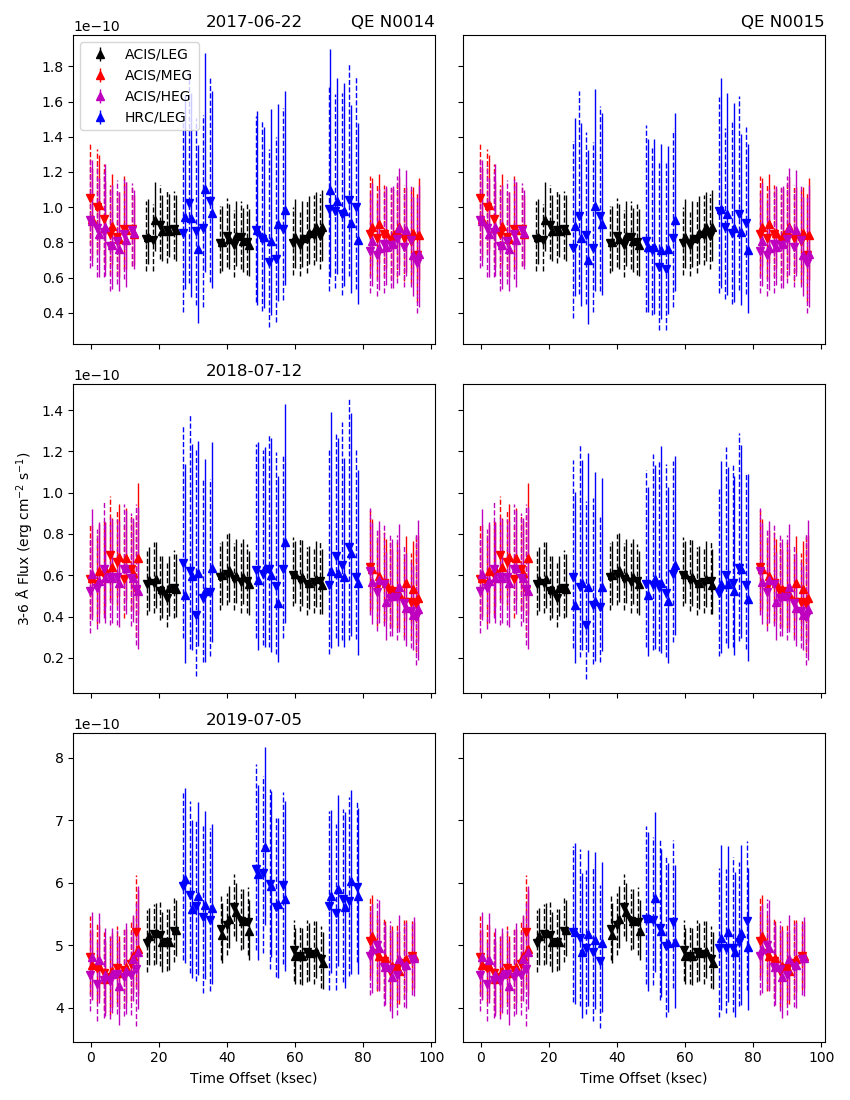
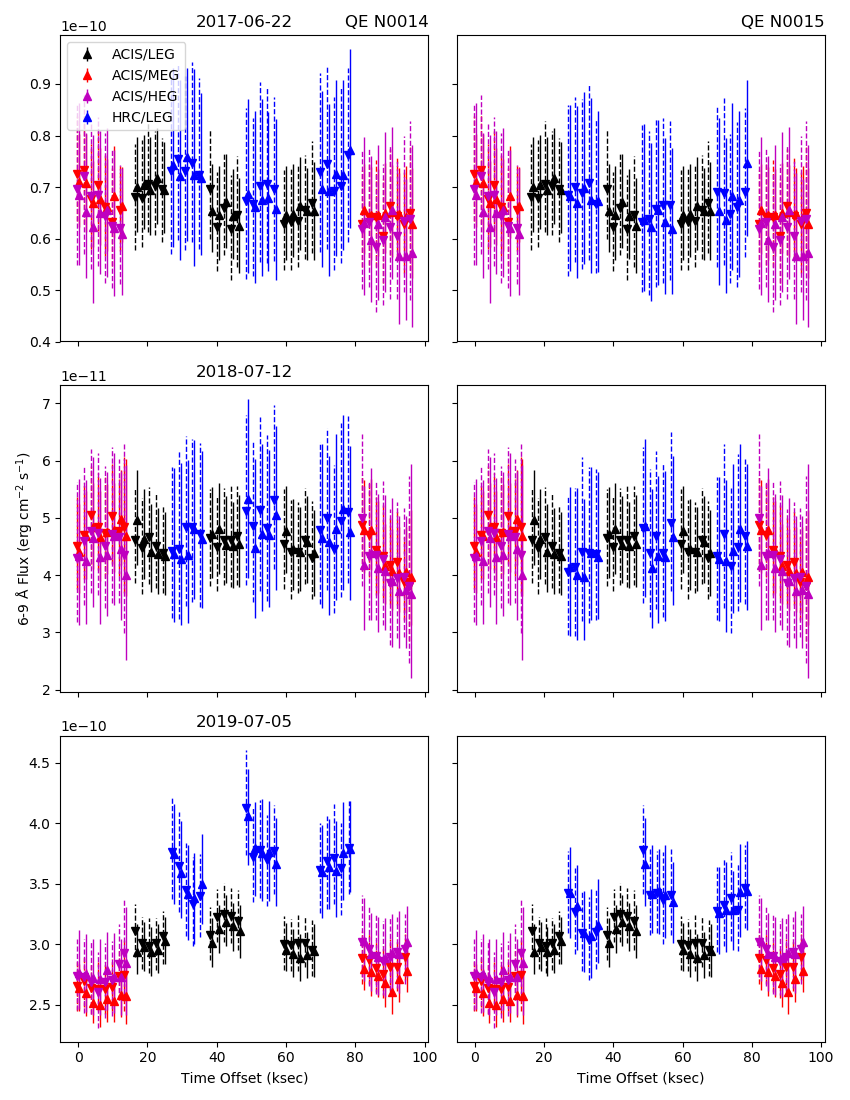
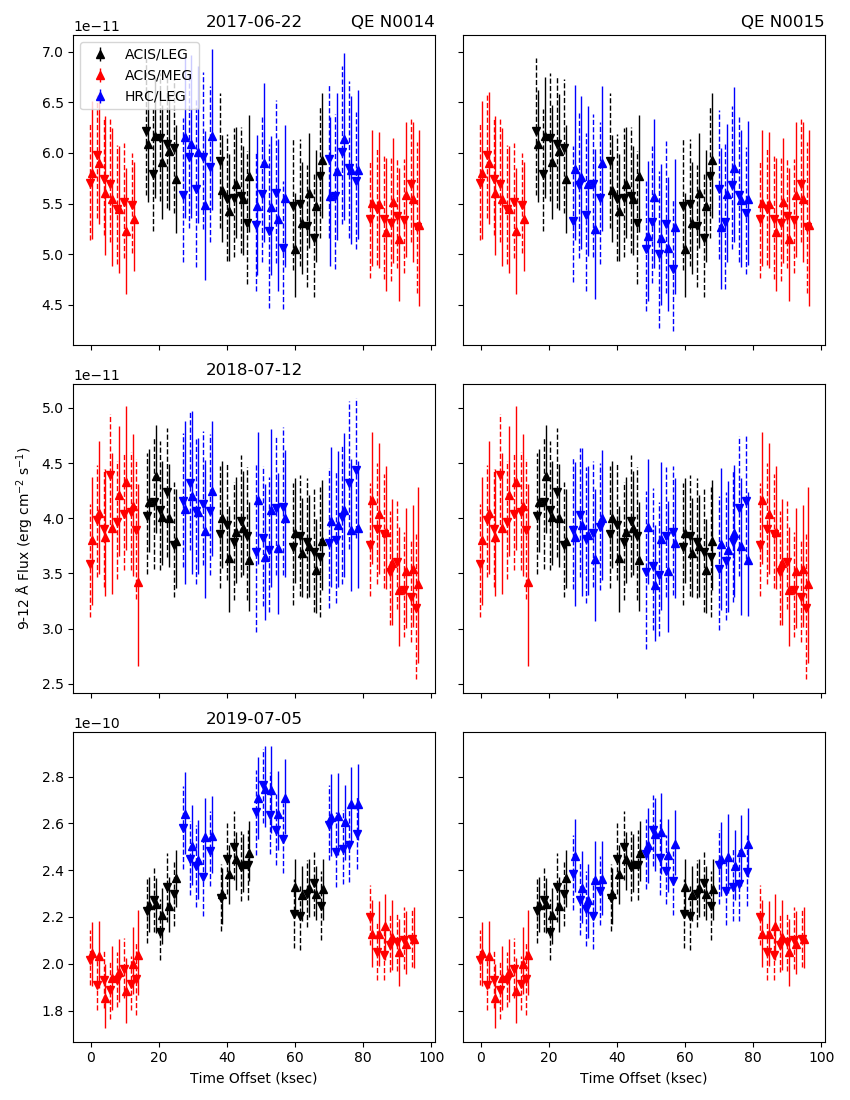
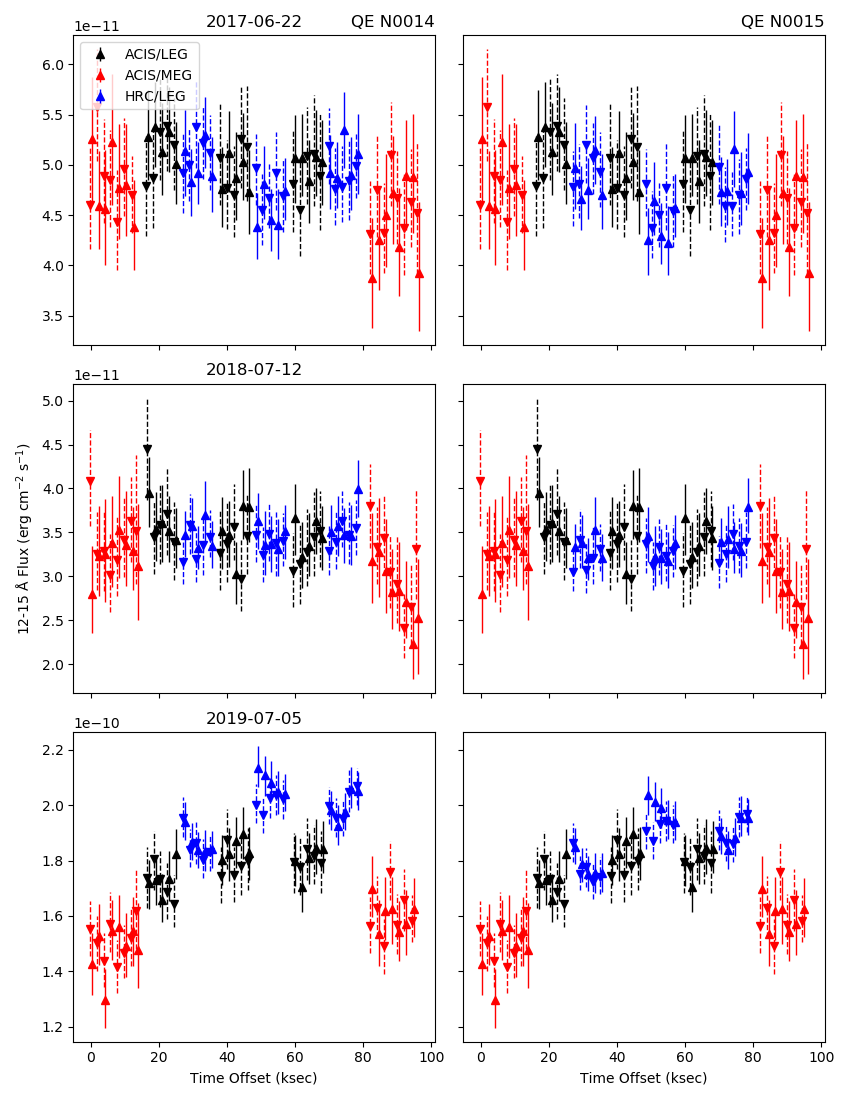
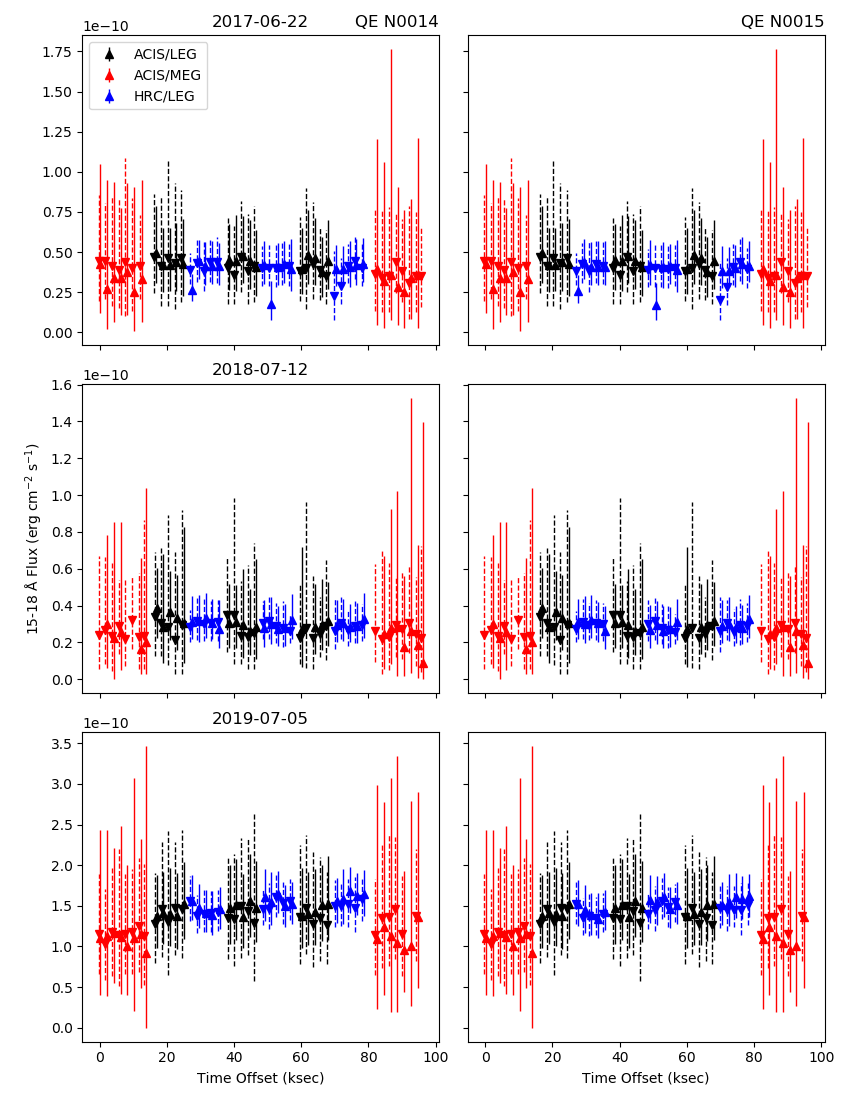
For higher energies, we are left with extragalactic sources such as the blazar Markarian 421, which is highly variable, displaying variations of >50% over timescales of 10s of ksec. For the purpose of cross calibration, it is often observed in a sequence of consecutive interleaved instrument/grating (ACIS-S with HETGS and LETGS, HRC-S with LETGS) configurations. We then model the flux light curve as a continuous auto-regressive model (CARMA; Kelly et al. 2014), adjusting the relative QE calibration of HRC-S to ensure the smoothest curve through the instrument changes to and from ACIS-S. Examples of these interleaved observations are shown in Fig. 3, for the past three years, in the 3-6 Å band. The left side panels show flux curves in the years 2017-2019, using the current CalDB HRC-S QE version N0014. As can be seen in the lower left plot, the discontinuity between HRC-S/LETG (blue) and ACIS-S/LETG (black) has become especially pronounced in recent years. Figs. 4-7 show similar trends for other wavelength bands, going out to 18 Å.
Calibrating the HRC-S to ACIS-S via Mkn 421 while assuming the ACIS-S QE remains constant requires, at the shortest wavelengths, raising the HRC-S QE increasingly over time. Though these data are at low signal-to-noise, some trends in the required QE correction are apparent. The discrepancy between ACIS-S and HRC-S is roughly correlated with wavelength: shorter wavelengths require more modification. Similarly, the disagreement between detectors is generally growing over time, and this appears to have begun around the same time as the HV change in 2012.
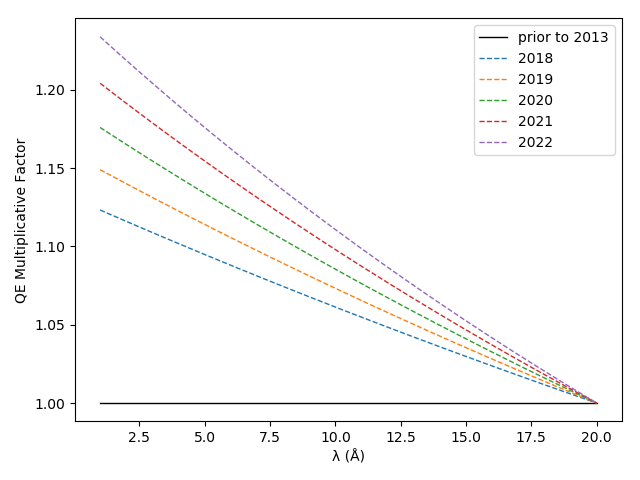
We address the flux discrepancy by raising the HRC-S QE relative to the grey correction the most at shortest wavelengths, linearly ramping down that excess correction to unity (i.e., no additional correction beyond the grey secular one) at 20 Å. Additionally, the QE will be linearly increased over time, post HV change, in order to compensate for the grey secular correction (Fig. 8).
Beginning in 2013, QE N0015 contains one calibration file per year. At the shortest wavelength (0 Å), the QE in S2 rises at the rate of 2.1% per year (a linear increase versus time with a slope of 1.021 units per year relative to 2012.5), which was the value found to most closely match the factor which must be applied to the highest energy HRC-S fluxes so that they agree with ACIS-S. This upwards correction shorter than 20 Å on S2 is counter to the grey decline implemented in the QEU. Together, the QEU correction and new QE counter-correction amount to a net "real" decline in HRC-S QE of 0.34% per year at the highest energies. This wavelength-dependent correction of the HRC-S QE, in addition to linearly ramping up with time, also linearly ramps down with wavelength until it is zeroed out relative to the grey correction at 20 Å.
The right side panels in Figs. 4-7 show how the HRC-S fluxes change with this QE update. They are generally in better agreement with ACIS-S, although the 6-9 Å and 12-15 Å bands still require additional scrutiny, particularly in the latest 2019 observations. The upcoming interleaved calibration observations in July, 2020 will shine further light on the situation.
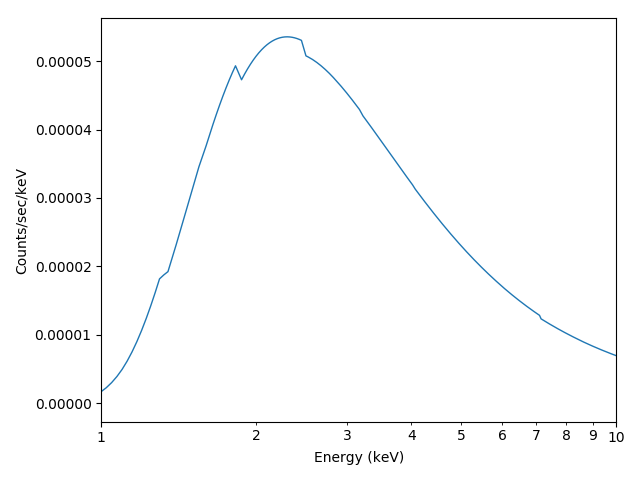
The plerionic supernova remnant G21.5-0.9 can provide a consistency check on our corrections. The plerion has a highly-absorbed spectrum, with X-ray emission almost entirely at energies greater than 1 keV (Fig. 9). As shown in Fig. 10, the latest HRC-S imaging plerion flux measurements using QE N0015 more closely match historical values than did those computed from the N0014 version.
1. All data reprocessing and response generation for this analysis were done using CIAO 4.10 and CalDB 4.9.0, or later. ↩