While the Earth rotates once a day about its axis between the north and south poles, it
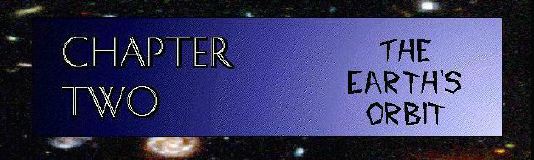
As the Earth orbits the Sun, the orientation of its rotational axis is held fixed, so that if we imagine it extended into space, it is always pointing towards Polaris, the pole star. As the Earth orbits around the Sun, for a portion of the year the Sun is in the same direction as the tilt happens to be. In other words, the Earth is in a part of its orbit where its tilt direction is towards the direction of the Sun. This means that the Northern Hemisphere will have warmer temperatures and hence summer. For the other portion of the year, the Earth has moved around the Sun, putting the Sun not in the direction in which the tilt happens to be. In other words, the tilt direction is off into space behind the Earth (towards the outer planets). With the top of the Earth now tilted away from the Sun, the Southern Hemisphere can enjoy summer. There are, of course, times in between as the Earth is orbiting when it has the Sun neither towards or away from the direction of the tilt. These times are when no hemisphere is experiencing any greater amount of sunlight than another, and so this is Spring or Fall for the hemispheres.
This chapter investigates both the causes and the effects of the changing of the seasons. We start simply by trying to quantify the observation "it's colder in the winter" and end by measuring the tilt of the Earth itself!
 revolves about the Sun in its orbit but once a year. The seasons are caused by the simple fact that the Earth's axis of rotation is not perpendicular to the plane of its orbit. Rather, the Earth's axis is tilted some 23°.5 away from the perpendicular, as shown in the figure (which is NOT to scale).
If you ask students what a particular season means to them, they'll probably mention the weather usually associated with it. Summer is hot. Winter is cold. Spring and Fall are in between. (For those of us living close enough to the poles, winter means snow, too!) A common misconception (even among a disturbingly large number of college graduates) is that the Earth is closer to the Sun during the summer, causing summer's warmer temperatures. This model, of course, is inconsistent with the fact that while the Northern Hemisphere has summer, the Southern Hemisphere has winter. Furthermore, while it's summer for the Northern Hemisphere, the Earth is actually slightly farther away from the Sun than during the winter.
As we know, during the Northern summer, the North Pole is tilted towards the Sun. During the winter, it is tilted away. This tilt causes the Sun to appear higher in the sky during the summer than during the winter. The higher Sun causes more hours of daylight and more intense, direct sunlight, or hotter conditions on the surface of the Earth. Questions to ask the class include: How is summer different from winter? What changes as winter gives way to spring? What changes are there as summer becomes fall? What about when winter approaches?
Activity 2-1: The Sun's Changing Path
The shadow stick measurements (Topic 2, "Sun Shadows") and measurements of the Sun's path on a dome (Topic 3, "Tracking the Sun Path in the Sky") from the previous chapter can be continued from week to week and month to month to show seasonal changes. Both will illustrate that the Sun follows a higher arc through the sky in the summer than in the winter. A comparison of shadow lengths all measured at midday will show that the shadow lengths increase as winter approaches becoming longest about December 21 (the shortest day) and then decrease again until June 21 (the longest day).
One way to keep track of the shadow lengths is to draw a graph by hand or on the computer. The plot should have midday shadow length (on the vertical axis) versus the date of the observation (on the horizontal axis). Each week, make a new measurement and update the graph. The measurements on the dome require more time, but provide a much better record of the Sun's path through the sky during more of the day rather than just at midday. Repeating the dome measurements each month (perhaps using the same plastic dome with different colored markers) will very clearly record the changes in the Sun's path through the sky during the year.
Activity 2-2: Recording Daily Temperatures
Weather is the result of an almost incalculable number of events. As such, it would be folly to attempt to predict a given city's temperature for a given date, far into the future. It would be equally foolish to point to an exceptionally cold day in June and declare "Winter's coming!" There are just too many variables for such a simplistic view. However, hidden among the randomness are trends which can be measured, and from which conclusions like "winter's coming" can be made.
The class can measure the outside temperature at a particular time each day, perhaps noon or lunch time. From newspapers or broadcast newscasts, the class can collect local high and low temperature readings for each day. These can be plotted on a graph or entered into a data base. For younger students, a classroom chart with cartoon thermometers with daily temperature marks can be made. The exact form of this activity is not important. One should emphasize the importance of recording data in an appropriate way. Sometimes making a simple graph can explain pages and pages of numbers. Simplicity is the key. With clear presentation of data, it is much easier to move forward and, for example, correlate the temperature measurements with the shadow stick and dome measurements.
Activity 2-3: Tracking Sunrise and Sunset Times
The tilt of the Earth in its orbit about the Sun affects not only the intensity of the solar radiation at a given location, but also the number of daylight hours. These two effects combine to create the weather we usually associate with each season.
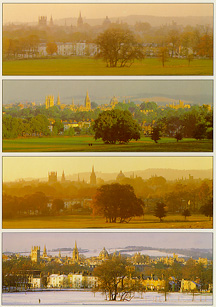
In the Northern Hemisphere, the Summer Solstice (longest day, shortest night) occurs around June 21. From June 21 to December 21, the days grow shorter and the nights longer. There are two equinoxes, during which the hours of daylight and night are equal: the Vernal Equinox (around March 21) and the Autumnal Equinox (around September 22). One can observe these changes by recording the times of sunrise and sunset and measuring the length of the day. Changes in these times are large enough (about a minute a day) to be seen on a graph. The figure below shows such a graph made from sunrise and sunset times at the National Optical Astronomical Observatory located on Kitt Peak near Tucson, Arizona for September to December. If begun in September and continued through the Winter Solstice (about December 22), the graph should show the gradual decrease in the number of daylight hours (in the Northern hemisphere) with the minimum at the Winter Solstice. It would be interesting to include either of the equinoxes on the graph as well.
Materials: Large paper from roll (3'X6'); markers; yardstick; pencil; circle labels; paints; adhesive dots; daily local newspaper.
The figure below shows a plot of sunrise and sunset times taken once a week from September through December. Notice that the shortest day occurs around December 21, as expected. In order to reinforce the connection between the number of daylight hours and average daily temperature, try making a wall-sized chart combining sunrise-sunset data with the daily temperature, as collected in the previous activity. While daily fluctuations in the temperature will be apparent, it is the general trends which we seek. How does the length of the day change with season? Does the daily temperature match this trend also?
Activity 2-4: The Analemma
This simple, long-term activity provides an easy way to record the changes of the Sun's apparent motion. We already know that the Earth's tilt causes the Sun's path to be higher in the sky during the summer than in the winter. Because the Earth's orbit around the Sun is not perfectly circular, the Sun's position at a specific time (as given by the clock) changes Eastwardly and Westerwardly as well. By reflecting sunlight onto the classroom ceiling and marking the Sun's position at the same time every week, we can record the change of the Sun's apparent motion, and after a year should notice a figure-eight-like figure known as an analemma.
 | Be sure to remind students that looking at the Sun can cause permanent eye damage- Never look directly at the Sun! |
|---|
Materials: Southern window with direct sunlight; small mirror; masking tape; adhesive dots (optional)
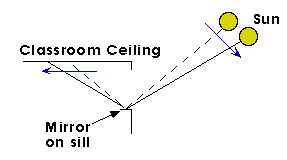 Place a very small mirror on the window sill and adjust so the sunlight shines on a clear area of the ceiling (without lights, mobiles, etc.). A mirror only an inch across is adequate. It is best to be able to tape the mirror there permanently, but at the very least, mark the mirror's position with masking tape. (If the reflection from a permanently-mounted mirror becomes distracting during the rest of the day, simply cover it with a sheet of paper).
Where would the spot of sunshine be if the Sun were lower in the sky? Higher? more Easterly? more Westerly? How much does the Sun appear to move each week? Is this change constant throughout the year? After we have measured for a year, could we use the previous year's analemma as a rough calendar? Would it work for every day or are there some periods of ambiguity? When are they?
The analemma is longer in one direction than in the other. This longer variation is caused by the seasonal motion of the Sun's path. The other variation (east-west) is the drift of solar time to the average solar time due to the eccentricity of the Earth's orbit around the Sun. (Eccentricity, while precisely defined, can be thought of as an ellipse's lack of circularity- for more information on planetary orbits, see Chapter 4 on The Solar System) If the Earth's orbit were perfectly circular, there would be no east-west drift, and the analemma would be reduced to a line, corresponding to the longer axis of the observed analemma!
 It is important to note that even without the tilt of the Earth, there would still be variations in temperature from one location to another, caused mainly by the curvature of the earth. Locations closer to the equator would still, on the average, be warmer than locations closer to the poles. Light and heat (radiation) from the Sun would still strike polar regions at more of an angle than nearer the Equator . This angle tends to "spread out" the same amount of energy over a larger area, thereby decreasing its intensity and the amount of heat it brings to the Earth. The activities in this topic demonstrate and test this assertion.
Activity 2-5: Energy from the Sun
Solar radiation is emitted in various forms which travel at the speed of light. Light travels through space as waves of different lengths. Our eyes can only see radiation as visible light, but radiation also occurs as radio waves, infrared rays, ultraviolet rays, X-rays and gamma rays. Together these waves make up the electromagnetic spectrum. Most of the radiation is "visible" - no coincidence!
Questions to ask: How can we measure the warmth from the Sun? Is it possible to find a way to measure it outside? What could we use and how could we show differences in temperature? How long would we have to wait until we take a comparative reading? Can we predict the variations? What might influence fluctuations in warmth? What experiences have students had which help in these predications? Will soil be warmer or colder than air temperature? Does this change during the day?
Materials: Thermometers; soil; sunlight; cardboard; stick; glue; pencils; flashlight; paper
Students discuss results of these experiments. What caused the highest or hottest temperature? Was this related to the time of day? What were students able to discover from their measurements? How accurate were their predictions? What factors helped them to predict well? What conclusions can they make about the effect of the Sun's rays on the Earth? If done at intervals over a period of time, did earlier experiments help their predictions?
Students may make a graph using this information either on graph paper or on the Bank Street Filer or on the database of AppleWorks. What other elements could students use to measure temperature? How could we devise an experiment to predict and record the temperature of water or sand in the sunlight? Student may predict and then test the model, record date and compare the results.
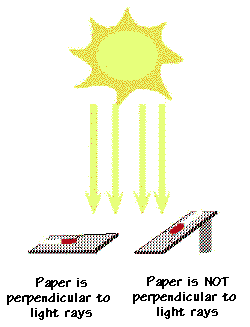
Activity 2-6: How Angle Spreads a Flashlight Beam
Does the illuminated spot on the graph paper always remain the same size? When is it larger? smaller? Is the spot always the same brightness? When is it brighter? fainter?
Materials: Graph paper; cardboard or plywood; masking tape; flashlight; markers.
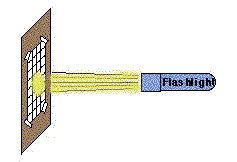 Attach a sheet of graph paper to the cardboard or plywood with the masking tape. Hold the board perpendicular to the floor and shine the flashlight directly onto the graph paper from the side, about two feet away. Be sure the flashlight is parallel to the floor, and, therefore, perpendicular to the paper. You might try placing the flashlight on a pile of books.
No matter how the board is tilted, nothing changes the amount of light which the flashlight produces. When the board is tilted, and the flashlight illuminates a larger area of the graph paper, the same amount of light energy must be spread over a larger area. The lighting is then less intense. Is there any difference between tilting the board and tilting the flashlight? What if we were using a larger, hotter light source, like a halogen lamp, or a star? Wouldn't the heat carried also be less intense when the board is tilted at larger angles? The next activity explores just this question using the closest star, the Sun.
Activity 2-7: How Angle Spreads Sunlight
| | Be sure to remind students that looking at the Sun can cause permanent eye damage- Never look directly at the Sun! |
|---|
This activity is similar to the previous activity in that it shows how light falling upon a 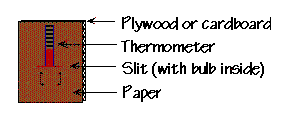 tilted surface is less intense than if it were falling directly. With light comes the energy to heat. This activity examines this "spreading out" of light by measuring how quickly and how much sunlight can warm two sheets of paper, one tilted, one not.
Materials: Two sheets of black construction paper; two pieces of cardboard or plywood; bricks or blocks to prop up board; masking tape; two thermometers.
 between the board and the paper, and the scale can be read without removing the thermometer. Tape the thermometers in place. Leave the assembled thermometers in the shade long enough so that they read the same outside temperature.
Discussion
Which paper was heated more quickly? Which got warmer? You might want to try different angles. Beware the effects of clouds and wind, as well as the shadows of over-anxious students! What do the results of this experiment tell you about the changes in temperature from Activity 2-5? What was the angle of the Sun when the temperature dropped? When the temperature was the highest?
Activity 2-8: Sunlight on a Curved Surface
We have already seen how the angle at which light strikes a surface affects its intensity. This activity will demonstrate that light shining on a curved surface may be more intense in one place than in others. If we shine a light on a uniformly colored ball, like a dodge ball or kick ball, the area experiencing more intense illumination will appear brighter than those receiving less intense light.
Materials: Slide or overhead projector or other source of directed light such as a bright flashlight; large, uniformly colored dodge or kick ball; books to lift light source to desired height
Discussion
Where on the ball was the light the brightest? Where was it the faintest? If you changed the orientation of the ball, what parts would be brightest? Which would be faintest? What if you moved the light source?
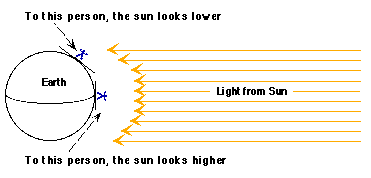
Activity 2-9: Sunlight on the Curved Earth
The previous activity demonstrated that the curvature of an object can cause different areas of the surface to receive light of differing intensities. This activity shows that the Earth is subject to this effect as well. We have seen in our earlier thermometer experiment that less intense light cannot heat a surface as quickly or as completely as intense, direct light. Therefore, we can predict that there should be areas of the Earth where the sunlight is more intense than at others. These areas should be warmer than other areas. This is why locations near the Equator are generally warmer than those closer to the Poles.
Our observations show that the Sun is higher in the sky during the summer than during the winter. Summer approaches for a given hemisphere (North or South) when the Earth moves to a place in its orbit in which that hemisphere's Pole (North or South) is tilted towards the Sun. This causes the Sun to be higher in the sky and its light to be more intense (less spread out). This more intense summer sunlight is better able to heat the land, air, and water. This warming is certainly consistent with our observations of the seasons.
Materials: Slide or overhead projector or other source of directed light such as a bright flashlight; large globe of the Earth; books to lift light source to desired height
Discussion
Does the bright area move across the face of the Earth? How should the globe be positioned to show winter? summer? spring? fall?
We have built a model of the seasons which agrees with our observations, but there is one important loose end; we accepted the tilt of the Earth as 23.°5. The next activity will allow us to measure this value! The final activity summarizes and demonstrates our model for the class.
Activity 2-10: Measuring the Earth's Tilt
While the effects of the tilted Earth model are consistent with observation, might it not be possible to measure the Earth's tilt directly? Using observations with a simple shadow stick, we can measure the Sun's angular height in the sky over the course of weeks and months. As we've seen, it is the tilt of the Earth's axis which causes the height of the Sun's path to change. In this activity, we will measure this change to infer the amount of the Earth's tilt. shows that as the height of the Sun changes, it casts different length shadows at midday. By recording these midday shadow lengths and the height of the shadow stick, we can "reconstruct" the situations from these days and measure the angular height directly. The difference of the angular heights of the Sun between an equinox (September 21 or March 21) and a solstice (December 21 or June 21) is equal to the tilt of the Earth's axis, 23.°5.
Materials: Shadow stick from Chapter 1; observations of the midday shadow lengths; large sheet of paper; colored markers; protractor.
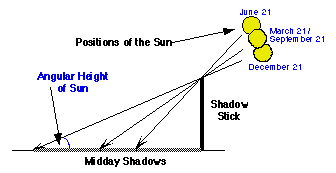 Obtain midday shadow lengths for convenient equinoxes or solstices (September 21, December 21, March 21, June 21) as described in the activity "Sun Shadows" of the previous chapter. Also make sure to keep a record of the height of the shadow stick.
Analysis Option
Mathematically, since the shadow stick and its shadows form right triangles, the shadow stick height and the shadow lengths are all that is needed to compute the Sun's angular height; it is simply the arctangent of the ratio between the shadow stick height and the shadow length. While such trigonometric functions are certainly beyond the scope of the elementary school classroom, this fact can be used to verify the students' results.
Discussion
When are the midday shadows the longest? Why? When are they the shortest? Why? What causes the shadow lengths to change? Can you relate your measurements to our model of the seasons?
Activity 2-11: Demonstrating the Tilted Earth
This activity demonstrates the model of the seasons we have been developing- that of an Earth whose axis of rotation is tilted by 23.°5 degrees with respect to the plane of its orbit around the Sun. By aligning the Earth's axis with a stationary point in space (the location of Polaris), it is easy to demonstrate the tilt of the Earth's axis during the course of an orbit about the Sun (i.e. a year).
Materials: Globe of the earth; sign to mark North; and masking tape. A student can act the part of the Sun and another student can hold the globe.
What differences in climates and seasons can you determine from the observations in these experiments? How would seasonal changes appear to you if you were on the equator or at the north or south poles? What is the pattern of sunlight at the equator? At the North Pole? At the South Pole? What were the differences in how the light was hitting the Northern Hemisphere as you carried the globe around the Sun?
 Back to Top


 |
Home
|
Home