The biggest challenge for a statistician to use astronomical data is the lack of mercy for nonspecialists’ accessing data including format, quantification, and qualification[2] ; and data analysis systems. IDL is costly although it is used in many disciplines and other tools in astronomy are hardly utilized for different projects.[3] In that regards, I welcome astronomers using python to break such exclusiveness in astronomical data analysis systems.
Even if data and software issues are resolved, there’s another barrier to climb. Validation. If you have a catalog, you’ll see variables of measures, and their errors typically reflecting the size of PSF and its convolution to those metrics. If a model of gaussian assumption applied, in order to tabulate power law index, King’s, Petrosian’s, or de Vaucouleurs’ profile index, and numerous metrics, I often fail to find any validation of gaussian assumptions, gaussian residuals, spectral and profile models, outliers, and optimal binning. Even if a data set is publicly available, I also fail to find how to read in raw data, what factors must be considered, and what can be discarded because of unexpected contamination occurred like cosmic rays and charge over flows. How would I validate raw data that are read into a data analysis system is correctly processed to match values in catalogs? How would I know all entries in catalog are ready for further scientific data analysis? Are those sources real? Is p-value appropriately computed?
I posted an article about Chernoff faces applied to Capella observations from Chandra. Astronomers already processed the raw data and published a catalog of X-ray spectra. Therefore, I believe that the information in the catalog is validated and ready to be used for scientific data analysis. I heard that repeated Capella observation is for the calibration. Generally speaking, in other fields, targets for calibration are almost time invariant and exhibit consistency. If Capella is a same star over the 10 years, the faces in my post should look almost same, within measurement error; but as you saw, it was not consistent at all. Those faces look like observations were made toward different objects. So far I fail to find any validation efforts, explaining why certain ObsIDs of Capella look different than the rest. Are they real Capella? Or can I use this inconsistent facial expression as an evidence that Chandra calibration at that time is inappropriate? Or can I conclude that Capella was a wrong choice for calibration?
Due to the lack of quantification procedure description from the raw data to the catalog, what I decided to do was accessing the raw data and data processing on my own to crosscheck the validity in the catalog entries. The benefit of this effort is that I can easily manipulate data for further statistical inference. Although reading and processing raw data may sound easy, I came across another problem, lack of documentation for nonspecialists to perform the task.
A while ago, I talked about read.table() in R. There are slight different commands and options but without much hurdle, one can read in ascii data in various styles easily with read.table() for exploratory data analysis and confirmatory data analysis with R. From my understanding, statisticians do not spend much time on reading in data nor collecting them. We are interested in methodology to extract information of the population based on sample. While the focus is methodology, all the frustrations with astronomical data analysis softwares occur prior to investigating the best method. The level of frustration reached to the extend of terminating my eagerness for more investigation about inference tools.
In order to assess those Capella observations, thanks to its on-site help, I evoke ciao. Beforehand, I’d like to disclaim that I exemplify ciao to illustrate the culture difference that I experienced as a statistician. It was used to discuss why I think that astronomical data analysis systems are short of documentations and why that astronomical data processing procedures are lack of validation. I must say that I confront very similar problems when I tried to learn astronomical packages such as IRAF and AIPS. Ciao happened to be at handy when writing this post.
In order to understand X-ray data, not only image data files, one also needs effective area (arf), redistribution matrix (rmf), and point spread function (psf). These files are called by calibration data files. If the package was developed for general users, like read.table() I expect there should be a homogenized/centralized data including calibration data reading function with options. Instead, there were various kinds of functions one can use to read in data but the description was not enough to know which one is doing what. What is the functionality of these commands? Which one only stores names of data file? Which one reconfigures the raw data reflecting up to date calibration file? Not knowing complete data structures and classes within ciao, not getting the exact functionality of these data reading functions from ahelp, I was not sure the log likelihood that I computed is appropriate or not.
For example, there are five different ways to associate an arf: read_arf(), load_arf(), set_arf(), get_arf(), and unpack_arf() from ciao. Except unpack_arf(), I couldn’t understand the difference among these functions for accessing an arf[4] Other softwares including XSPEC that I use, in general, have a single function with options to execute different level of reading in data. Ciao has an extensive web documentation without a tutorial (see my post). So I read all ahelp “commands” a few times. But I still couldn’t decide which one to use for my work to read in arfs and rmfs (I happened to have many calibration data files).
| arf | rmf | psf | pha | data | |
|---|---|---|---|---|---|
| get | get_arf | get_rmf | get_psf | get_pha | get_data |
| set | set_arf | set_rmf | set_psf | set_pha | set_data |
| unpack | unpack_arf | unpack_rmf | unpack_psf | unpack_pha | unpack_data |
| load | load_arf | load_rmf | load_psf | load_pha | load_data |
| read | read_arf | read_rmf | read_psf | read_pha | read_data |
[Note that above links may not work since ciao documentation website evolves quickly. Some might be routed to different links so please, check this website for other data reading commands: cxc.harvard.edu/sherpa/ahelp/index_alphabet.html].
So, I decide to seek for a help through cxc help desk several months back. Their answers are very reliable and prompt. My question was “what are the difference among read_xxx(), load_xxx(), set_xxx(), get_xxx(), and unpack_xxx(), where xxx can be data, arf, rmf, and psf?” The answer to this question was that
You can find detailed explanations for these Sherpa commands in the “ahelp” pages of the Sherpa website:
http://cxc.harvard.edu/sherpa/ahelp/index_alphabet.html
This is a good answer but a big cultural shock to a statistician. It’s like having an answer like “check http://www.r-project.org/search.html and http://cran.r-project.org/doc/FAQ/R-FAQ.html” for IDL users to find out the difference between read.table() and scan(). Probably, for astronomers, all above various data reading commands are self explanatory like R having read.table(), read.csv(), and scan(). Disappointingly, this answer was not I was looking for.
Well, thanks to this embezzlement, hesitation, and some skepticism, I couldn’t move to the next step of implementing fitting methods. At the beginning, I was optimistic when I found out that Ciao 4.0 and up is python compatible. I thought I could do things more in statistically rigorous ways since I can fake spectra to validate my fitting methods. I was thinking about modifying the indispensable chi-square method that is used twice for point estimation and hypothesis testing that introduce bias (a link made to a posting). My goal was make it less biased and robust, less sensitive iid Gaussian residual assumptions. Against my high expectation, I became frustrated at the first step, reading and playing with data to get a better sense and to develop a quick intuition. I couldn’t even make a baby step to my goal. I’m not sure if it a good thing or not, but I haven’t been completely discouraged. Also, time helps gradually to overcome this culture difference, the lack of documentation.
What happens in general is that, if a predecessor says, use “set_arf(),” then the apprentice will use “set_arf()” without doubts. If you begin learning on your own purely relying on documentations, I guess at some point you have to make a choice. One can make a lucky guess and move forward quickly. Sometimes, one can land on miserable situation because one is not sure about his/her choice and one cannot trust the features appeared after these processing. I guess it is natural to feel curiosity about what each of these commands is doing to your data and what information is carried over to the next commands in analysis procedures. It seems righteous to know what command is best for the particular data processing and statistical inference given the data. What I found is that such comparison across commands is missing in documentations. This is why I thought astronomical data analysis systems are short of mercy for nonspecialists.
Another thing I observed is that there seems no documentation nor standard procedure to create the repeatable data analysis results. My observation of astronomers says that with the same raw data, the results by scientist A and B are different (even beyond statistical margins). There are experts and they have knowledge to explain why results are different on the same raw data. However, not every one can have luxury of consulting those few experts. I cannot understand such exclusiveness instead of standardizing the procedures through validations. I even saw that the data that A analyzed some years back can be different from this year’s when he/she writes a new proposal. I think that the time for recreating the data processing and inference procedure to explain/justify/validate the different results or to cover/narrow the gap could have not been wasted if there are standard procedures and its documentation. This is purely a statistician’s thought. As the comment in where is ciao X?[5] not every data analysis system has to have similar design and goals.
Getting lost while figuring out basics (handling, arf, rmf, psf, and numerous case by case corrections) prior to applying any simple statistics has been my biggest obstacle in learning astronomy. The lack of documenting validation methods often brings me frustration. I wonder if there’s any astronomers who lost in learning statistics via R, minitab, SAS, MATLAB, python, etc. As discussed in where is ciao X? I wish there is a centralized tutorial that offers basics, like how to read in data, how to do manipulate datum vector and matrix, how to do arithmetics and error propagation adequately not violating assumptions in statistics (I don’t like the fact that the point estimate of background level is subtracted from observed counts, random variable when the distribution does not permit such scale parameter shifting), how to handle and manipulate fits format files from Chandra for various statistical analysis, how to do basic image analysis, how to do basic spectral analysis, and so on with references[6]
- This is quite an overdue posting. Links and associated content can be outdated.
- For the classification purpose, data with clear distinction between response and predictor variables so called a training data set must be given. However, I often fail to get processed data sets for statistical analysis. I first spend time to read data and question what is outlier, bias, or garbage. I’m not sure how to clean and extract numbers for statistical analysis and every sub-field in astronomy have their own way to clean to be fed into statistics and scatter plots. For example, image processing is still executed case by case via trained eyes of astronomers. On the other hand, in medical imaging diagnosis specialists offer training sets with which scientists in computer vision develop algorithms for classification. Such collaboration yields accelerated, automatic but preliminary diagnosis tools. A small fraction of results from these preliminary methods still can be ambiguous, i.e. false positive or false negative. Yet, when such ambiguous cancerous cell images at the decision boundaries occur, specialists like trained astronomers scrutinize those images to make a final decision. As medical imaging and its classification algorithms resolve the issue of expert shortage under overflowing images, I wish astronomers adopt their strategies to confront massive streaming images and to assist sparse trained astronomers
- Something I like to see is handling background statistically in high energy astrophysics. When simulating a source, background can be simulated as well via Makov Random field, kriging, and other spatial statistics methods. In reality, background is subtracted once in measurement space and the random nature of background is not interactively reflected. Regardless of available statistical methodology to reflect the nature of background, it is difficult to implement it for trial and validation because those tools are not compatible for adding statistical modules and packages.
- A Sherpa expert told me there is an FAQ (I failed to locate previously) on this matter. However, from data analysis perspective like a distinction between data.structure, vector, matrix, list and other data types in R, the description is not sufficient for someone who wants to learn ciao and to perform scientific (both deterministic or stochastic) data analysis via scripting i.e. handling objects appropriately. You might want to read comparing commands in Sharpa from Shepa FAQ
- I know there is ciaox. Apart from the space between ciao and X, there is another difference that astronomers do not care much compared to statisticians: the difference between X and x. Typically, the capital letter is for random variable and lower case letters for observation or value
- By the way, there are ciao workshop materials available that could function as tutorials. Please, locate them if needed.
Whenever LHC (Large Hardron Collider, several posts from the slog) is publicly advertised, the grand scale of accelerator (26km) is the center of attention for these unprecedented controlled experiments for particle physics researches. Controlled in conjunction of factorization in statistical experiment designs to eliminate unknowns and to factor in external components (covariates, for example). By the same token, not the grand scale of the accelerator, but the detector and controlled/isolated system, and its designs for collecting data seem most important to me. Without searching for reports, I want to believe that many countless efforts have been put into detectors and data processors, which seem to be overshadowed because of the grand scale of the accelerating tube.
For fun and honoring the speaker’s showing it to the public, you might like to see this youtube rap again.
As a statistician, curious about the detector and the physics leading the designs of such expensive and extreme studies, I was more interested in knowing further on
- how data are collected and
- how study was designed or what are the hypotheses
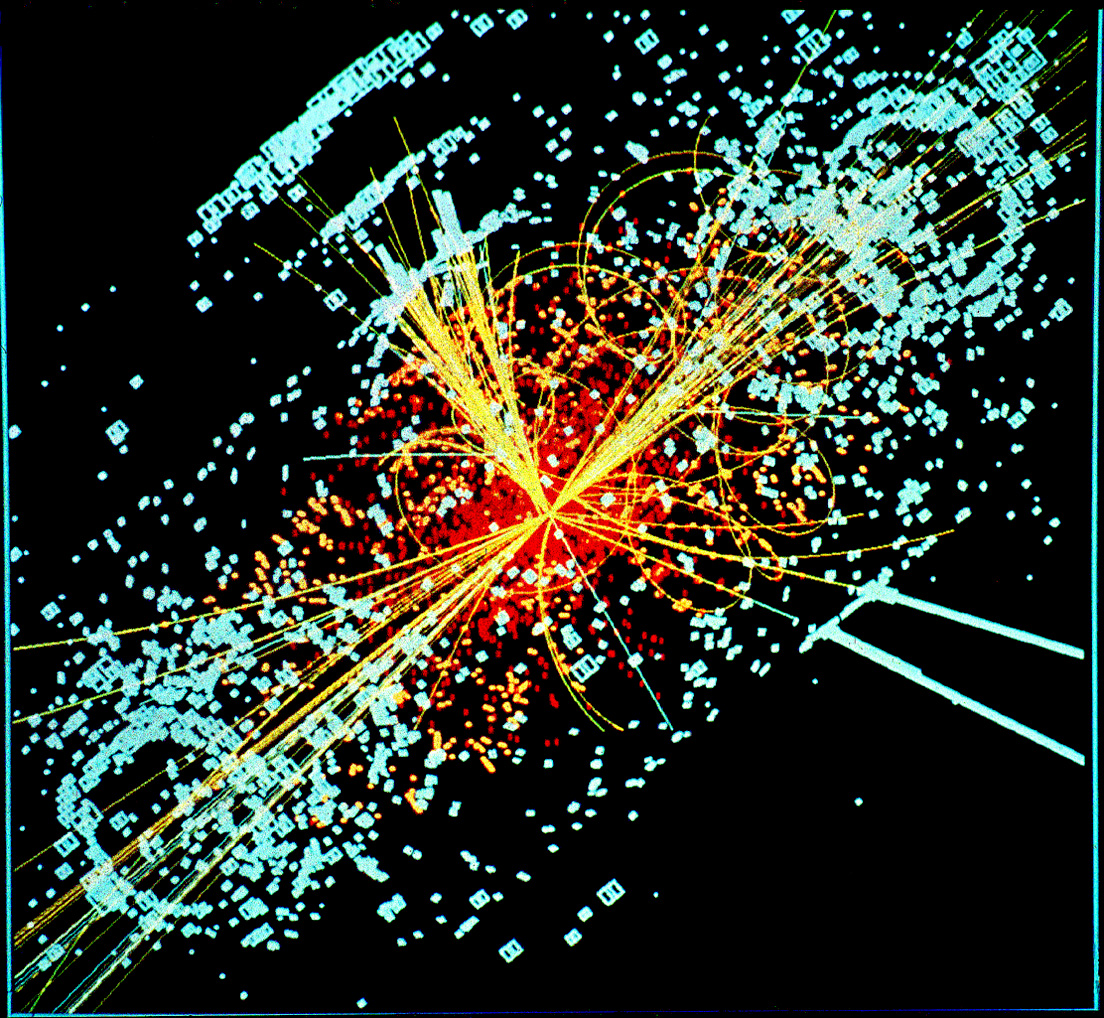
not the scale of the accelerator nor the feeling inside the 2 degree vacuum tube. There was no clue to find out partial answers to these questions through the public lecture. So, I hope some slog readers could help me understand better the following issues spawn from this public lecture. Let me talk my questions statistically and try to associate them with the image above.
- Uncertainty Principle
The uncertainty principle by physicists is written roughly as follows:
Δ E Δ t > h
where h is Plank’s constant. Instead of energy and time, Δ x Δ p > h, location and momentum is used as well. This principle is more or less related to precision or bias. One cannot measure things with 100% precision. In other word, in measuring quantities from physics, there is no exact unbiased estimator (asymptotically unbiased is a different context). In order to observe subparticle in a short time scale, the energy must be high. Yet, unless the energy is extremely high, the uncertainty of when the event happen is huge so that no one can assign exact numerals when the eveny happen. This uncertainty principle is the primary reason for such large accelerator so that particle can gain tremendous energy and therefore, an observer can determine the location and the time of the event (collision, subsequent annihilation, and scatters of subparticles) with uncertainty from the principle of physics.
- What is Uncertainty?
I’ve always had a conflicting notion about uncertainty in statistics and astronomy. The uncertainty from the Heigenberg’s uncertainty principle and the uncertainty from measure theory and the stochastic nature of data. Although the word is same but the implications are different. The former describes precision as discussed above and the later accuracy (Bevington’s book describes the difference between precision and accuracy, if I recall correctly). When an astronomer has data and computes a best fit and one σ from the chi-square, that σ is quantifying the uncertainty/scale of the Gaussian distribution, a model for residuals that the astronomer has chosen for fitting the data with the model of physics.
When it comes to measurement errors it’s more like discussing precision, not accuracy or the scale parameters of distribution functions (family of distributions). Either measurement errors, or computing uncertainty via chi-square minimization or Bayesian posterior distribution estimation, most of procedures to understand uncertainties in astronomical literature is based on parametrizating uncertainties. Luckily we know that Gaussian and Poisson distribution for parametrization works almost all cases in astronomy. Yet, my understanding is that there’s not much distinction between precision and accuracy in astronomical data analysis, not much awareness about the difference between the uncertainty principle from physics and the uncertainty by the stochastic nature of data. This seems causing biased or underestimated results. With jargon of statistics, instead of overlooking, the issues of model mis-identification and model uncertainty[1] of other disciplines are worth to be looked into to narrow the gap.
As a statistician, I approach the problem of uncertainty hierarchically. Start from the simplest that sigma is known and used the given sigma as the ground truth. If statistics does not advocate such condition, then move to a direction of estimating it, and testing whether it is homogenous or heterogeneous error, etc to understand the sampling distribution better and device statistics accordingly. During the procedure, I’ll add a model for measurement errors. If Gaussian, adding statistical uncertainty terms and measurement error terms works well, an easy convolution of Gaussian distributions (see my why gaussianity?). I might have to ignore some factors in my hierarchical modeling procedure if their contribution is almost none but the hierarchical model becomes too complicated for such mediocre gain. Instead, it would be easy to follow the rule of thumb strategy developed by astronomers with great knowledge and experience. Anyway, if parametric strategy does not work, I’ll employ nonparametric approaches. Focusing on Bayesian methodology, it’s like modeling hierarchically from parametric likelihoods and informative, subjective priors to nonparametric likelihoods, objective, noninformative priors. Overall, these are efforts of modeling both physics and errors assuming that measurements are taken accurately; multiple measurements and collecting many photons quantifies how accurately the best fit is obtained. On the other hand, under the uncertainty principle, intrinsic measurement bias (unknown but bounded) is inevitable. Not statistics but physics could tell how precise measurements can be taken. Still it’s uncertainty but different kind. I sometimes confront astronomers mixing strategies of calibrating the uncertainties of different grounds and also I got confused and lost.
I’d like to say that multiple observations (the amount of degrees of freedom in chi-square minimizations, and bins in histograms) are realizations of coupling of bias and variance (precision and accuracy; measurement errors and statistical uncertainty in sigma/error bar) from which the importance of proper parametrization and regularized optimization is never enough to be emphasized to get that right 68% coverage of the uncertainty in a best fit, instead of simple least square or chi-square. Statisticians often discuss the mean square error (see my post [MADS] Law of Total Variance) than the error bar to account for the overall uncertainty in a best fit.
I’m afraid that my words sound gibberish – I hope that statisticians with good commands of literal and scientific languages discuss the uncertainty of physics and of statistics and how it affects choosing statistical methods and drawing statistical inference from (astro)physical data. I’m also afraid that people continue going for one sigma by feeding the data into the chi-square function and adding speculated systematic errors (say 15% of the computed sigma from the chi-square minimization) without second thoughts on the implications of uncertainty and on assumptions for its quantification methods.
- Identifiability
I wonder how the shot of above image is taken when protons are colliding. There should be a tremendous number of subparticles generated from the collisions of many protons. Unless there is a single photo frame that takes traces of all those particles (collision happens in 3D camera chamber? Perhaps, they use medical imaging, tomography techniques but processing time wise I doubt its feasibility), I think those traces are the reconstruction of multiple cross sectional shots. My biggest concern was how each line and dot you see from the picture can be associated to a certain particle. Physics and standard model can tell that their trajectories are distinguishable, depending on their charges, types, and mass but there are, say, millions of events happening in the matter of extremely short time scale! How certain one can say this is the trace of a certain particle.
The speaker discussed massive data and uncertainty as another challenge. So many procedures in terms of (statistical) data analysis seem not explored yet although theory of physics is very sophisticated and complicated. If physics is an deductive/deterministic science, then statistics is inductive/stochastic. I personally believe that theories are able to conclude the same from both physical and statistical experiments. I guess now it’s time to prove such thesis with data and statistics and it starts with identifying particles’ traces and their meta-data.
- image reconstruction
To create an image of many particles as above when we have the identifiability issue and the uncertainty in time and space, I wonder how pictures are constructed from each collision. The lecturer used an analogy of a dodecaheron calendar with missing months to deliver the feeling of image reconstruction in particle physics. Whenever I see such images of many ray traces and hear promises that LHC will deliver, I’ve been wondering how they reconstruct those traces after the particle collisions and measuring times of events. Thanks to the uncertainty principle and its mediocre scale, there must be some tremendous constraints and missings. How much information is contained in that reconstructed image? How much information loss is inevitable due to those constraints. It would be very interesting to know each step from detectors to images and find statistical and information theoretical challenges.
- massive data processing
Colliding one proton to the other seems ideal to discover the unification theory advocating the standard model by tracing individual relatively small number of particles. If so, the picture above could have been simpler than what it looks. Unfortunately, it’s not the case and huge number of protons are sent for collision. I’ve kept heard the gigantic size of data that particle physics experiments create. I wondered how such massive data are processed while the speaker showed the picture of one of world best computing facilities at CERN. Not just for automated pipelining but for processing, cleaning, summarizing, and evaluating from statistical aspects would require clever algorithms to make most of those multiple processors.
- hypothesis testing
I still think that quests for searching particles via LHC are classical decision theoretic hypothesis testing problem: the null hypothesis is no new(unobserved particle) vs. the alternative hypothesis contains the model/information of new particle by the theory (SUSY, antimatter etc). Statistically speaking, in order to observe such matter or to reject null hypothesis comfortable, we need statistically powerful tests, where Neyman-Pearson test/construction is often mentioned. One needs to design an experiment that is powerful enough (power here has two connotations: one is physically powerful enough to make proton have high energy so that one can observe particles in the brief time and space frame, and the other is statistically powerful such that if such new particles exist, the test is powerful enough to reject the null hypothesis with decent power and false discovery rate). How to transcribe data and models into a powerful test seems still an open question to physicists. You can check discussions from the links in the PHYSTAT LHC 2007 post.
- source detection
In the similar context of source detection in astronomy, how do physicists define and segregate source (particle of interest, higgs, for example) from background? It’s also related to identifiability of particles shown in the picture. How can a physicist see an rare event among tons of background events which form a wide sampling distribution or in other words, that have a huge uncertainty as an ensemble. Also the source event has its own uncertainty because of the uncertainty principle. How to form robust thresholding methods? How to develop Bayesian learning strategies for better detection? Perhaps the underlying (statistical) models are different for particle physics and for astronomy, but the basic idea of how to apply statistical inference seem not much different from the fact that 1. background can be more dominant, 2. background is used for the null hypothesis, and 3. the source distribution comprise the alternative distribution. It’ll be very interesting to collect statistics for source detection and formalize those methods so that consistent source detection results can be achieved by devising statistics suits the data types.
- cliche and irony
I’d like to quote two phrases from the public lecture.
finding an atom in a haystack
A cliche for all groups of scientists. I’ve heard “finding a needle in a haystack” so many times because of the new challenge that we confronted from the information era. On the other hand, replacing “needle” to “atom” was new to me. Unfortunately, my impression is that physicists are not equipped with tools to do such data mining either a needle or an atom. I wonder what computer scientists can offer them for this more challenging quest to answer the fundamental question about the universe.
it’s an exciting time to be physicists
The speaker used physicists but I’ve heard the same sentence from astronomers and statisticians with their professions replaced with physicists. After hearing it too often from various people, I became doubtful since I cannot feel such excitements imminently. It feels like after hearing change too often before it happens, one cannot feel the real progress of changes. Words always travel faster than actions. Sometimes words can be just empty promise. That’s why I thought it’s a cliche and irony. Perhaps it’s due to that fact I’m at the intersection of the combination of these scientist sets, not at the center of any set. Ironically, defining boundaries is also fuzzy nowadays. Perhaps, I’m already excited and afraid of transiting down to a lower energy level. Anyway, being enthusiastic and living in an exciting time seems different matter.
- What will come next?
I haven’t heard the news about Phystat 2009, whose previous meetings occurred every odd year in the 21st century. Personally, their meeting agenda and subsequent proceedings were very informative and offered clues to my questions. I hope the next meeting soon to be held.
- the notions of model uncertainty among astronomers and statisticians are different. Hopefully, I have time to talk about it