V ~ < 21: Cross-correlation with existing catalogs. Source lists, plate scans etc. ---> Chandra data products
V ~ > 21: New CCD imaging data
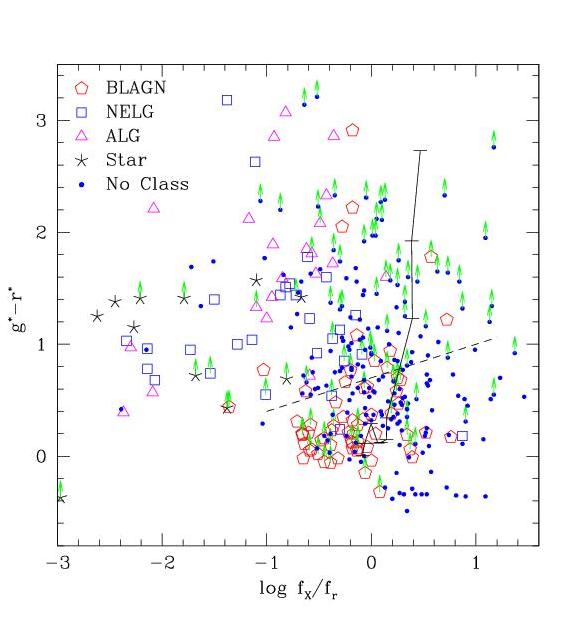 |
| From Green et al. (2004), SDSS colors derived for Chandra sources from our NOAO Mosaic imaging plotted against log fx/fr in the 0.5-2 keV band. Objects in the lower right part of the plot are largely consistent with optically-selected quasars and can be classified as such with high confidence even without spectroscopy; a possible demarcation is shown as the dotted line. Clustered with stars at low fx/fr are galaxies that likely have little X-ray contribution from an active nucleus. The solid curve traces the mean expected quasar track from z=0.4 to 4.6 in bins of 0.5, assuming have constant logfx/fr = -0.3. The shift towards larger logfx/fr arises only from the imposed flux limits. |
3-FILTERS PROVIDE:
Date Last Modified: 22 April 2002
Contact: Webmaster